ABSTRACT
Background: The purpose of this study was to analyze morphometry of the subaxial cervical spine pedicles in an Indian population based on computed tomography (CT), and thus assess the safety and feasibility of cervical pedicle screw in the subaxial cervical spine.
Methods: CT scans of 500 subaxial cervical spine vertebrae were analyzed from 100 patients presenting to our institution and undergoing cervical spine CT scan for an unrelated cause as part of ATLS protocol. Pedicle width (PW), pedicle axis length (PAL), pedicle transverse angulation (PTA), and lateral pedicle distance (LPD) were calculated on axial CT scans, and pedicle height (PH), pedicle length (PL), superior pedicle distance (SPD), and pedicle sagittal angulation (PSA) were calculated on sagittal CT scans.
Results: The mean PW ranged from 4.3 mm at C3 to 5.7 mm at C7. Mean PH ranged from 5.5 mm at C3 to 6.1 mm at C7. Mean PTA ranged from 44.5° at C3 to 37.1° at C7. PSA ranged from 16.65° at C3 to 3.29° at C7. Mean LPD ranged from 1.6 mm at C3 to 3.4 mm at C6. Mean SPD ranged from 3.5 mm at C3 to 1.15 mm at C7. Mean PAL ranged from 29.6 mm at C3 to 33.04 mm at C7. Mean PL ranged from 5.2 mm at C3 to 5.78 mm at C7.
Conclusions: Our CT-based morphometric study confirms that cervical pedicle screw placement is possible in most of the Indian population except at C3 in females. A thorough understanding of pedicle anatomy with proper CT-based preoperative planning can mitigate the risk associated with pedicle screw placement in subaxial cervical spine.
INTRODUCTION
Cervical pedicle screw (CPS) fixation is found to be superior compared with lateral mass screws because it provides more axial, bending, and torsional stability,1 has a higher pullout strength,2 and has a low risk of loosening with cyclical loading.3 Despite its biomechanical superiority, CPS fixation is not universally accepted among surgeons because their accuracy and safety remain technically challenging because of the close proximity of vital structures.4 Inherent variability in pedicles at each level and lack of consistent suitable landmarks for CPS placement3,5 add to the technical challenge.
Various cadaveric studies have been done in the past,2,6–8 but comparative computed tomography (CT) data from the age-matched population has shown significant differences.9 Recent advances in CT have made anatomic measurements more accurate. There have been only a few CT-based studies from the Indian subcontinent on cervical pedicles, providing limited data for a proper CPS placement.10
The present study was undertaken to determine the 3-dimensional pedicle geometry by calculating variables like pedicle length (PL), pedicle height (PH), pedicle width (PW), pedicle axis length (PAL), pedicle transverse angulation (PTA), pedicle sagittal angulation (PSA), superior pedicle distance (SPD), and lateral pedicle distance (LPD) in a large group of young asymptomatic individuals and to appreciate the level-, side-, and sex-specific morphologic differences among the Indian population. Such normative data will provide the surgeon with an improved understanding of cervical pedicle anatomy and will allow for safer pedicle screw insertion in cervical spine.
MATERIALS AND METHODS
Ours was an observational/prospective study to evaluate the CT-based morphology of subaxial cervical spine pedicles in asymptomatic individuals. This study was approved by the ethics committee of our institute.
Measurements of 500 subaxial cervical spine pedicles were done in 100 individuals (50 male and 50 female) presenting to our institute and undergoing cervical spine CT scan for an unrelated cause as part of the ATLS protocol.
Individuals with a history of cervical spine abnormalities; previous cervical spine surgery; congenital or developmental malformation of the cervical spine; or inflammatory, infectious, neoplastic, or traumatic conditions were excluded.
Data Collection
CT scans of the cervical spine were done using the CT machines Siemens Somatom Sensation (40 slices) and Siemens Definition AS (64 slices; Siemens, Erlangen, Germany). A preliminary lateral scout scan was done, followed by (3.0-mm) helical scans of the cervical spine and sagittal and coronal reconstructions at (0.75-mm) intervals.
Image Analysis
Measurements were made from the third cervical vertebra (C3) down to the seventh cervical vertebra (C7). On axial CT scans, the parameters measured were PW, PAL, PTA, and LPD. On sagittal CT scan images, the linear and angular parameters measured were PH, PL, SPD, and PSA. Linear parameters were measured in millimeters. Angular parameters were measured to one tenth of a degree. All the paired cervical pedicle parameters were measured individually for the left and the right sides, using same digital measurement software. The measurements were performed independently by an observer and cross checked by a consultant spine surgeon. Figures 1 through 4 show the parameters measured on the axial images. Figures 5 through 8 show the parameters measured on sagittal images.
Pedicle width was defined as the mediolateral outer diameter of the pedicle at its isthmus.
Pedicle axis length (maximum screw length) was defined as the length of the pedicle axis from its projection on the dorsal surface of the lateral mass to the anterior vertebral body surface.
Pedicle transverse angulation was defined as the angle between the pedicle axis and the vertebral body midsagittal axis.
Lateral pedicle distance of the pedicle axis was defined as the mediolateral distance between the pedicle axis projection on the dorsal surface of lateral mass surface and the lateral border of the lateral mass.
Pedicle height was defined as the superoinferior outer diameter of the pedicle at its isthmus.
Pedicle sagittal angulation was defined as the angle between the pedicle axis and a line parallel to the inferior end plate of the same vertebra.
Superior pedicle distance was defined as the superoinferior distance between the pedicle axis projection on the dorsal lateral mass surface and the inferior margin of the inferior articular process of superior vertebrae.
Pedicle length was defined as the distance between the pedicle-lateral mass junction and the pedicle-vertebral body junction.
Statistical Analysis
Statistical analysis was carried out using Statistical Package for the Social Sciences (IBM SPSS) software version 16. For categoric variable we used the χ2 test or Fisher exact test and in case of continuous variable Student t test was used, statistical significance with a P value <.05 was used as cut off level.
RESULTS
The men had a mean age of 29.3 ± 8.1 years, whereas the women had a mean age of 31.3 ± 7.6 years.
PW, PH, PAL, PTA, LPD, PL, SPD, and PSA were observed to be significantly dependent (P < .05) on sex as well as on spinal level. All parameters were found to be greater in men than women at each spinal level except at C7, where SPD was found to be similar in both sexes. There was no significant difference (P > .05) between the left- and right-sided parameters at any spinal level. In general, PW, PH, PAL, LPD, and PL were found to be significantly increasing craniocaudally, with a few exceptions. At C7 PH was found to be smaller than at C6 in both sexes. At C4 PL was found to be the same as C3 in women. At C3 and C4 PAL was not found to be significantly different in men.
On the other hand, SPD, PSA, and PTA were found to be significantly decreasing craniocaudally. There was no typical lateral mass at C7. The mean PH was found to be greater than mean PW at all spinal levels in both sexes.
PW and PH
The mean PW increased from 4.7 mm at C3 to 6.0 mm at C7 in men, and from 4.3 mm at C3 to 5.4 mm at C7 in women (Table 1 and Figures 9 and 10). The PW was found to be less than 4.0 mm in 6 female patients, 8 pedicles at C3, and 2 pedicles at C4. A PW of less than 4.0 mm was found bilaterally in 4 patients and unilaterally in 2 patients. There was no male patient with a PW less than 4.0 mm.
Pedicle width (PW) and pedicle height (PH).
Overall mean pedicle width in male and female patients (mm).
Overall mean pedicle height in male and female patients (mm).
The mean PH increased from 5.7 mm at C3 to 6.4 mm at C6 in men, and 5.2 mm at C3 to 6.1 mm at C6 in women. There was no pedicle with PH less than 4.0 mm in either sex. Maximum PH was 7.4 mm at C6 in men, and 6.7 mm at C6 in women. Minimum PH was 4.7 mm at C3 in men and 4.6 mm at C3 in women.
PL and PAL
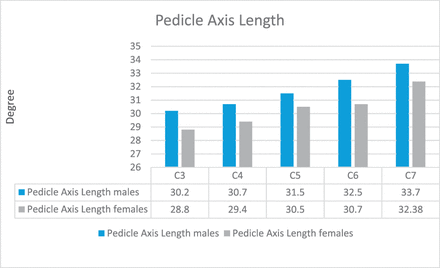
The mean PL was found to increase, from 5.1 mm at C3 to 5.7 mm at C7 in women, and from 5.2 mm at C3 to 5.8 mm at C7 in men. The mean shortest PAL was found to be 28.8 mm at C3 in women, and 30.2 mm in men at C3 and C4. The longest PAL was 33.7 mm in men and 32.38 mm in women at C7 (Table 2 and Figures 11 and 12).
Pedicle length (PL) and pedicle axis length (PAL).
Overall mean pedicle length in male and female patients (mm).
Overall mean pedicle axis length in male and female patients (mm).
LPD C3-6 Vertebrae
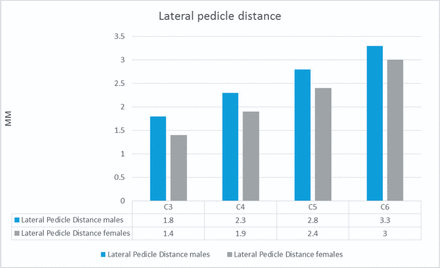
The mean shortest LPD observed was 1.4 mm in women and 1.8 mm in men at the C3 level, whereas the longest LPD was found to be 3 mm in women and 3.8 mm in men at the C6 vertebrae level (Table 3 and Figure 13). Because C7 did not have a typical lateral mass, LPD was not calculated at the C7 level.
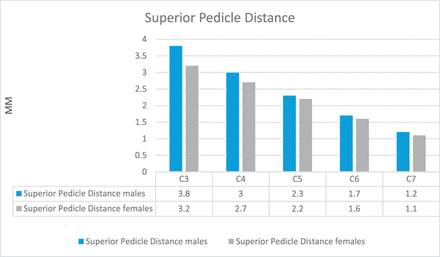
Lateral pedicle distance (LPD) C3-6 vertebrae and superior pedicle length (SPD).
Overall mean lateral pedicle distance in male and female patients (mm).
Superior Pedicle Distance
Analysis revealed that SPD was significantly different (P < .05) at each level (Table 3 and Figure 14).
Overall mean superior pedicle distance in male and female patients (mm).
PTA C3-7 Vertebrae
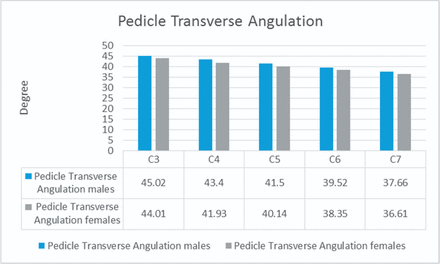
The mean PTA was found to have a significantly (P < 0.05) decreasing trend from 45.02° at C3 to 37.66° at C7 in men, and from 44.01° at C3 to 36.61° at C7 in women (Table 4 and Figure 15).
Pedicle transverse angulation (PTA) C3-7 vertebrae and pedicle sagittal angulation (PSA) C3-7 vertebrae.
Overall mean pedicle transverse angulation in male and female patients (degrees).
PSA C3-7 Vertebrae
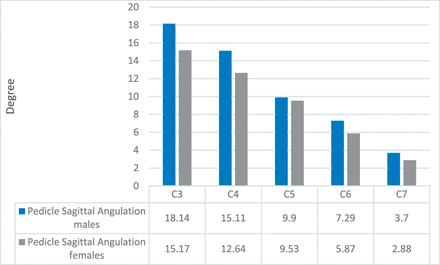
The mean PSA was found to have a significant (P < .05) decreasing trend from 18.14° at C3 to 3.7° at C7 in men, and in women it decreased from 15.17° at C3 to at 2.88° at C7. The pedicles were directed cranially at C3 to C5, whereas from C6 to C7 they were horizontal to caudally directed (Table 4 and Figure 16).
Overall mean pedicle sagittal angulation in male and female patients (degrees).
DISCUSSION
Multiple cadaveric studies2,6–9,11 and CT-based studies9,10,12–21 have been done in the past to help determine subaxial cervical spine morphology and geometry in order to generate data to help spine surgeons in reducing complications associated with CPS placement. Panjabi et al.11 in 1991 were the first to study cervical spine 3-dimensional morphology in cadavers. Okuyama et al.9 in 1994 first used CT to obtain a proper understanding of cervical spine anatomy and found significant differences in data when they were compared with cadaveric measurements, and the authors suggested that for cadavers preserved for a long time, the preservatives used may cause morphologic changes.
In 2012, Chazano et al.22 studied and found differences in pedicle morphology among different ethnicities. In our study we that found morphometric parameters were significantly larger in men compared with women, and no significant differences were noted between left- and right-sided measured pedicle parameters at any spinal levels, which was in accordance with previous studies in other ethnic groups.12,13,23,24
PW, PH, and PTA values in our study were found to be smaller than those in European/American, Thai, and Chinese populations.12,13,24
An optimum of 4.5 mm PW is required for safe CPS placement in order to have 0.5 mm of bone stock on each side.13,24,25 We observed in our study that PW was larger than 4.5 mm at all spinal levels in both sexes, except at C3 in women (4.3 mm), which suggests that pedicle screw fixation is possible in male and female Indians at all subaxial cervical spine levels, except at C3 in female individuals.
PH/PW ratio >1 was found in this study at all levels, which was similar to findings for other ethnic groups. Mean PH was 5.5 mm at C3, 5.7 mm at C4, 5.9 mm at C5, 6.2 mm at C6, and 6.1 mm at C7, which was smaller than what Rao et al.12 noted in the American population, with mean PH values of 6.1 mm at C3, 6.2 mm at C4, 6.1 mm at C5, 6.1 mm at C6, and 6.5 mm at C7. Chanplakorn et al.13 found that overall mean PH in the Chinese population was 5.7 mm at C3, 6.01 mm at C4, 5.8 mm at C5, 5.9 mm at C6, and 6.8 mm at C7. Wasinpongwanich et al23 noted that overall mean PH in the Thai population was 6.3 mm at C3, 6.5 mm at C4, 6.9 mm at C5, 6.9 mm at C6, and 7.4 mm at C7. They observed that PH significantly increased at each level from C3 to C7, and there was no statistically significant difference between left and right pedicle height, except at C4 where left was greater than right. Banerjee et al.16 observed overall mean PH values in the Indian population of 6.37 mm at C3, 6.52 mm at C4, 6.77 mm at C5, 6.42 mm at C6, and 6.73 mm at C7.
Various methods and techniques have been described to determine the safe screw trajectory, but none of these provided a consistent recommendation for screw entry and trajectory. Abumi et al.26,27 proposed the entry point to be slightly lateral to the center of the lateral mass and close to the inferior margin of the cranially adjacent vertebrae. They recommended transverse angulation be medially inclined from 25° to 45° and parallel to the upper end plate in the sagittal plane axis. Karaikovic et al.28 suggested different entry point locations for different cervical vertebral levels. Pedicle entrance was located at lateral vertebral notch at C4, which gradually moved medially away from the notch at C5-7. Sakamoto et al.29 recommended screw insertion angles of approximately 50° from C3 to C6 and 35° at C7 vertebrae. PTA helps in establishing an ideal entry point and trajectory for a safe CPS insertion. In our study, the PTA was compared to that of European/American, Thai, and Chinese populations. Mean PTA in our study was 44.5° at C3, 42.6° at C4, 40.5° at C5, 39.5° at C6, and 37.1° at C7. Rao et al.12 found that overall mean PTA was 46.5° at C3, 47° at C4, 45.5° at C5, 41.5° at C6, and 33° at C7 in the American population. Wasinpongwanich et al.23 noted that overall PTA in the Thai population was 46.3° at C3, 48.5° at C4, 48.8° at C5, 44.3° at C6, and 38.7° at C7. Chanplakorn et al.13 observed that PTA in the Chinese population was 42.7° at C3, 44.2° at C4, 44.05° at C5, 42.21° at C6, and 39.04° at C7. On comparing our results with those of previously published Indian studies we found a difference in PTA. Banerjee et al.16 observed that mean PTA was 45.44° at C3, 46.35° at C4, 46.59° at C5, 43.22° at C6, and 36.91° at C7 in the Indian population. Gupta et al.15 in their cadaveric study observed that mean PTA was 37.9° at C3, 42.75° at C4, 38.5° at C5, and 38.4° at C6.
A proper understanding of PSA is essential to determine CPS trajectory in the sagittal plane to avoid damage to traversing nerve roots in proximity. Although generally a cranial orientation from C3 to C5 and a horizontal to caudal orientation from C6 to C7 were observed in other studies,12,23 a significant difference in PSA was noted.
The overall mean PSA in our study was16.65° at C3, 13.87° at C4, 9.71° at C5, 6.58° at C6, and 3.29° at C7. Overall mean PSA in a study by Rao et al.12 in the American population was 13.65° at C3, 7.5° at C4, 0.9° at C5, −2.95° at C6, and −3° at C7. Chanplakorn et al.13 noted PSA in the Chinese population was 10.7° at C3, 5.47° at C4, 0.56° at C5, −6.8° at C6, and −10.6° at C7.
PL and PAL help in proper screw size selection. The overall mean PAL in our study was 29.6 mm at C3, 30.16 mm at C4, 31.05 mm at C5, 32.15 mm at C6, and 33.04 mm at C7, and was found to be smaller compared with other ethnic groups. In comparison, Rao et al.12 noted the overall mean PAL to be 32.6 mm at C3, 32 mm at C4, 32.55 mm at C5, 32.35 mm at C6, and 30.75 mm at C7 in the American population. Al-saeed et al.30 noted in an Arab population that PAL was 32.2 mm at C3, 32.3 mm at C4, 33 mm at C5, 33.5 mm at C6, and 34 mm at C7. Wasinpongwanich et al.23 noted in the Thai population that PAL was 29.10 mm at C3, 30.48 mm at C4, 32.05 mm at C5, 33.40 mm at C6, and 34.36 mm at C7.
Similarly, PL when compared with different ethnic groups was found to be smaller in our study. In our study PL was 5.2 mm at C3, 5.27 mm at C4, 5.4 mm at C5, 5.72 mm at C6, and 5.78 mm at C7. Rao et al.12 noted the overall mean PL in the American population was 5.25 mm at C3, 5.2 mm at C4, 5.6 mm at C5, 5.8 mm at C6, and 5.7 mm at C7. Wasinpongwanich et al.23 noted that mean PL in the Thai population was 5.55 mm at C3, 5.76 mm at C4, 6.07 mm at C5, 6.13 mm at C6, and 6.28 mm at C7.
CONCLUSION
We observed from our study that CPS placement is possible in majority of Indian population except at C3 in females. On comparison with other studies, we noted that cervical pedicle morphology varies with spinal level, sex, and ethnicity. These factors should be taken into account while planning for pedicle screw placement. This study provides quantitative data on pedicle morphology from a young normative/disease-free Indian population, which can give reference data to surgeons regarding safe screw placement. However, preoperative measurements on CT scans are necessary to accommodate individual variation in order to provide greater accuracy and safety in CPS insertion.
Footnotes
Disclosures and COI: This research did not receive any specific grant from funding agencies in the public, commercial, or not-for-profit sectors.
- ©International Society for the Advancement of Spine Surgery

