

Fig. 1
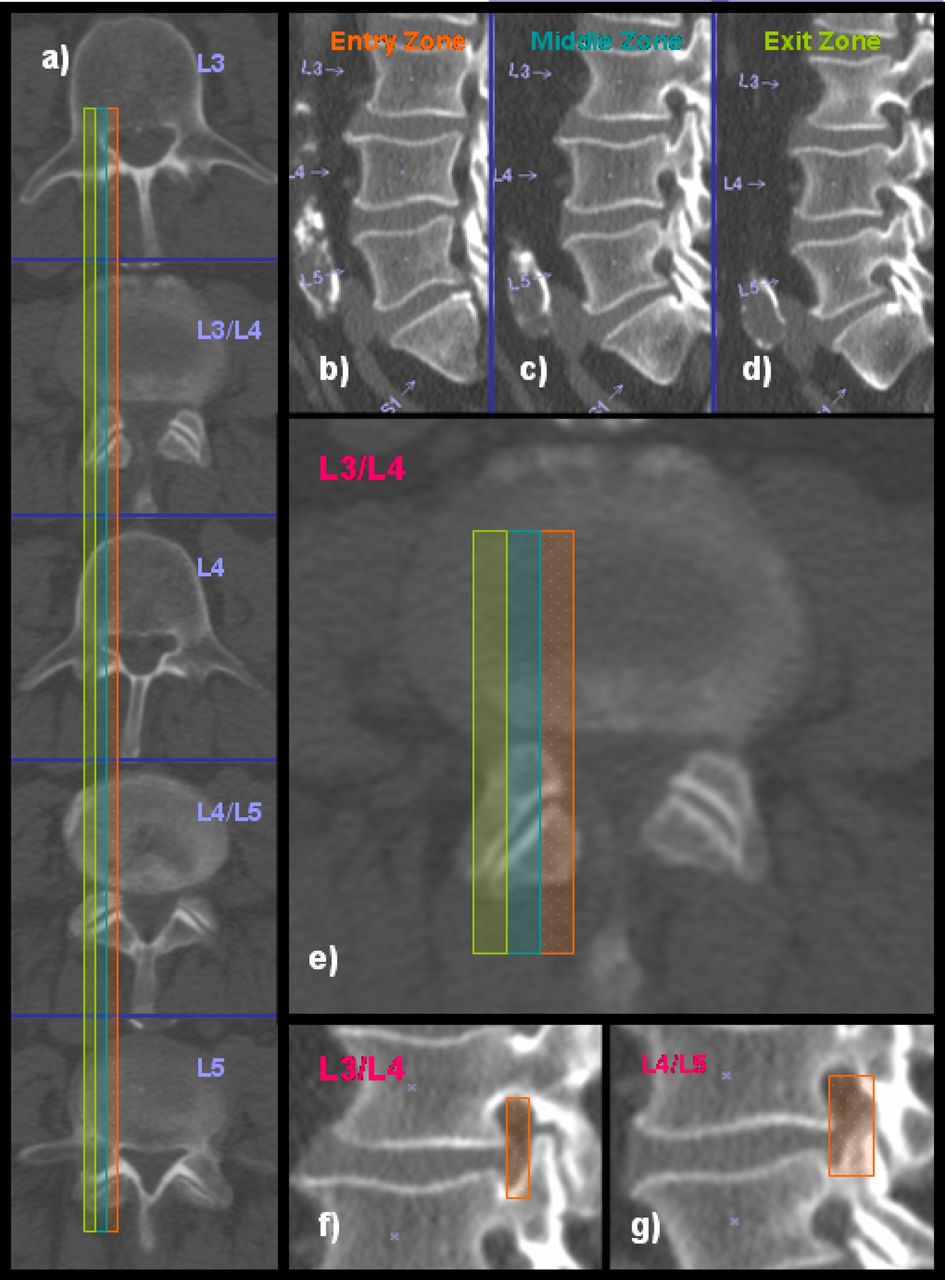
Fig. 1
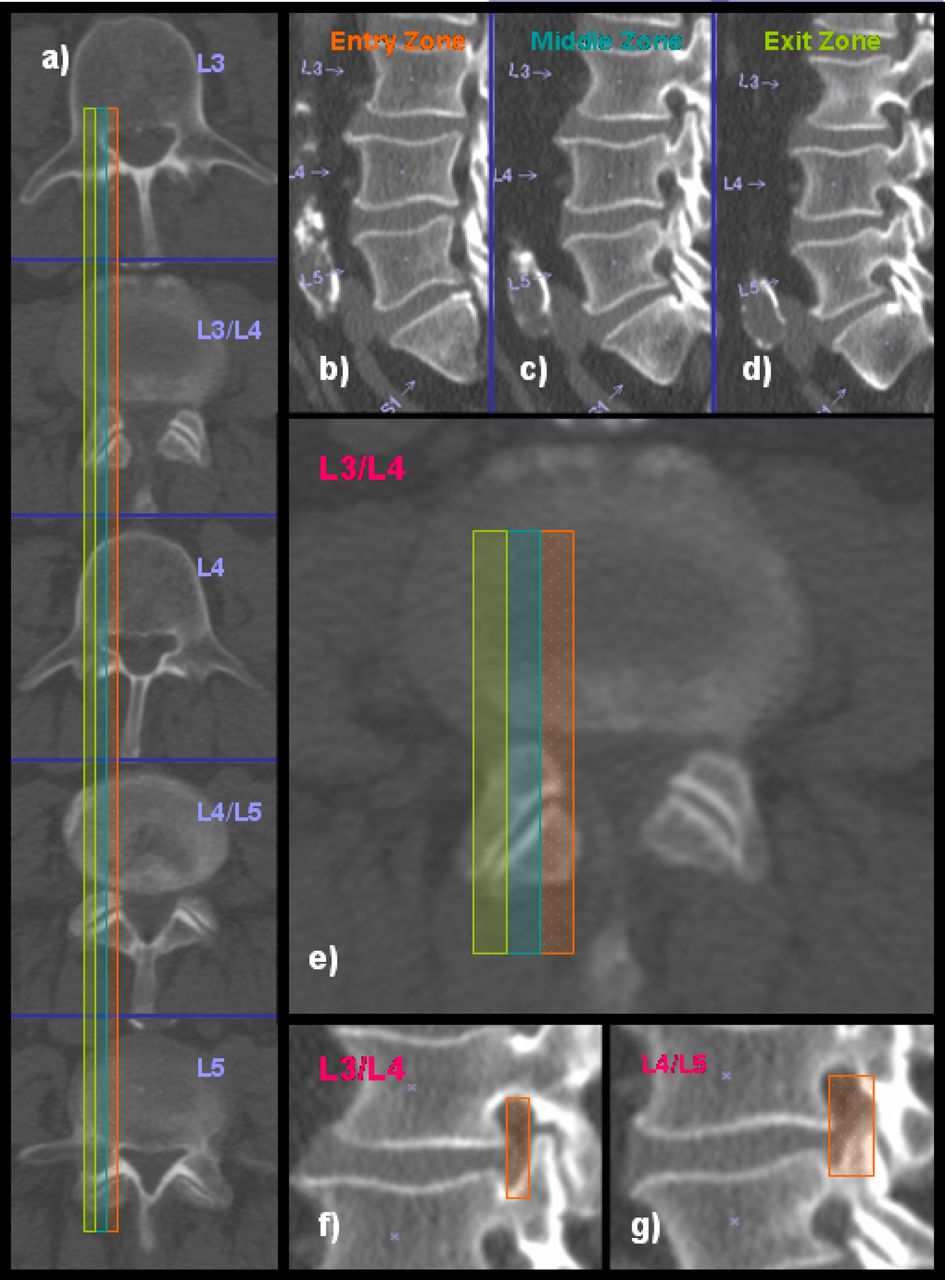
Preoperative CT scans of a 70 year old male: a) panel on the left shows axial CT cuts from L3 to L5, b-d) panel shows sagittal CT cuts through the entry (shaded orange), middle (shaded turquoise), and exit zone (shaded green) of the lumbar neuroforamina, e) axial CT cut through the L3-4 disc space showing the stenotic lesion in the middle zone at that level, f-g) sagittal CT cuts through the middle zone at L3-4, and the L4-5 level. The neuroforaminal height (orange shade area) is less than 5 mm. The neuroforaminal width is less than 2 mm. Both indicators are consistent with spinal stenosis.
In this issue


Related Articles
Cited By...
- Difficulties, Challenges, and the Learning Curve of Avoiding Complications in Lumbar Endoscopic Spine Surgery
- Reliability Analysis of Deep Learning Algorithms for Reporting of Routine Lumbar MRI Scans
- Artificial Intelligence Comparison of the Radiologist Report With Endoscopic Predictors of Successful Transforaminal Decompression for Painful Conditions of the Lumber Spine: Application of Deep Learning Algorithm Interpretation of Routine Lumbar Magnetic Resonance Imaging Scan